![]()
Collision Reconstruction Tidbits
,
James R. Schmidt, Jr., BSME, Sr. Collision Reconstruction Engineer ::::
A vehicle traveling 50 miles per hour (73.3 feet per second) emergency brakes to a stop on a dry roadway in 119 feet. That same vehicle traveling down a 5% grade, for example, takes longer to stop, as the downgrade effectively reduces the friction. The braking distance for that vehicle would be 128 feet. When traveling uphill the opposite is true, as the uphill grade (again, assuming 5%) effectively increases the friction, resulting in a braking distance of 111 feet. The higher the friction, the quicker a vehicle can stop. The lower the friction, the longer it takes a vehicle to stop.
Speed from video can be an easy thing to evaluate. Of course, we must be able to see the vehicle of interest and the video needs to be of a good quality with a constant/known frame rate. Speed is simply distance divided by time. For example, if a vehicle travels 100 feet in 1.37 seconds, its speed is 73 feet per second (or approximately 50 mph). Alternatively, if the view of the vehicle is limited to something small, or just a “blip”, the time it takes the vehicle to travel its wheelbase (i.e. distance from front axle to rear axle) can be used. For example, a 2007 Honda Odyssey minivan passes through the field of view of a surveillance camera, and in doing so it travels its wheelbase of 118 inches (9.83 feet) in 4 frames of a 30 frame per second video (0.133 seconds). Speed is calculated at 73.8 feet per second (or approximately 50 mph). Each case is unique, and evaluations ranging from simple to complex, using traditional to advanced 3D computer-aided methods, can be performed to determine speed and many other parameters that may be of interest.
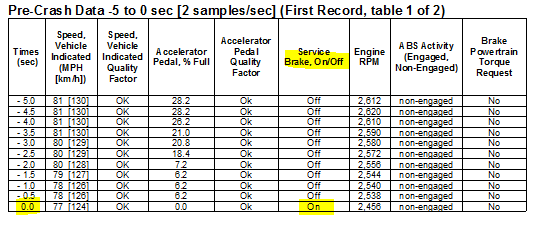
Event data is a reconstructionist’s dream! However, the data has to be vetted by the trained engineer. All physical evidence and available data, including the event data, is reviewed and evaluated. If it is confirmed that the event data is associated with the crash of interest, it can be used to evaluate such things as the approach of the vehicle(s) to impact and the severity of the crash. For example, the following event data shows 5 seconds of pre-crash data from a passenger vehicle in ½ second increments. At 0.5 seconds prior to impact (-0.5), the vehicle is traveling 78 mph and the brakes are OFF. At time zero (0.0), the brakes come ON and the impact occurs.
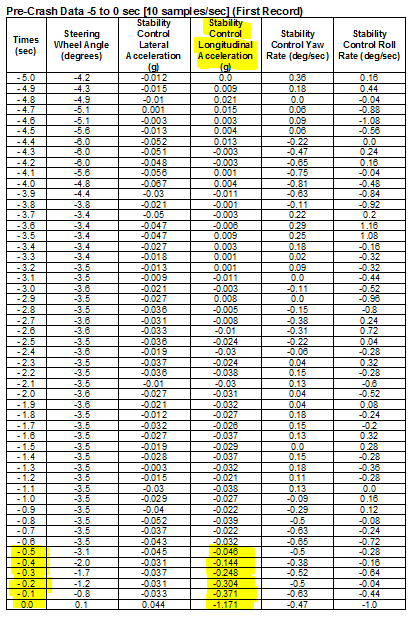
Looking at the more refined pre-crash data that comes from this particular vehicle’s airbag control module (ACM) (i.e. 0.1 second increments below, as opposed to the larger 0.5 second increments above), a more precise determination of when the brakes came ON, as well as the level of braking, can be made. At -0.5 to -0.4 seconds, the brakes are coming on, and the braking is less than full/emergency braking prior to impact. This data, including steering and yaw rate data if necessary, can be used to evaluate the positioning and path of the vehicle leading up to impact.
These are just a few reconstruction tidbits. You may already know these things. You may have already read these things before, as I’ve written on them in the past. Regardless, know that the engineers at DJS Associates are here, experienced, ready, and excited to work with you on your collision reconstruction cases!
James R. Schmidt, Jr., BSME, is a Sr. Collision Reconstruction Engineer with DJS Associates and can be reached via email at experts@forensicDJS.com or via phone at 215-659-2010.
Tags: James R. Schmidt | Pre-Crash Data
Have A Question About This Article or Want to Contact the Expert?
Request An Expert
Fill out the form below so we may refer an expert
Areas of Expertise
Additional Areas of Expertise
From Our Blog
Who is DJS Associates?
